The changing seasons are making Sweet Pea Growing quite difficult – the season is getting earlier and much shorter (on average). Here we discuss a few charts showing changing local weather conditions. [All three of the following charts are based on daily data for Yeovilton, Somerset. Source: Visual Crossing]
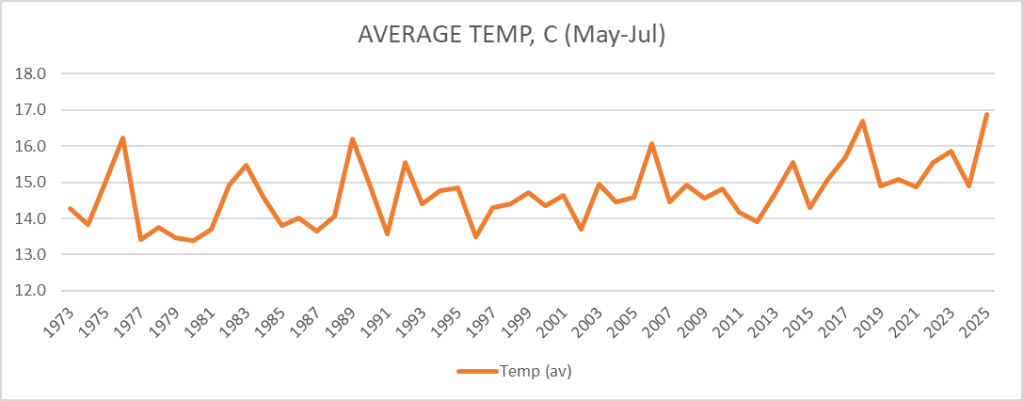
The average temperature (C) during the main part of the growing season (taken to be May-Jul) is on the rise.
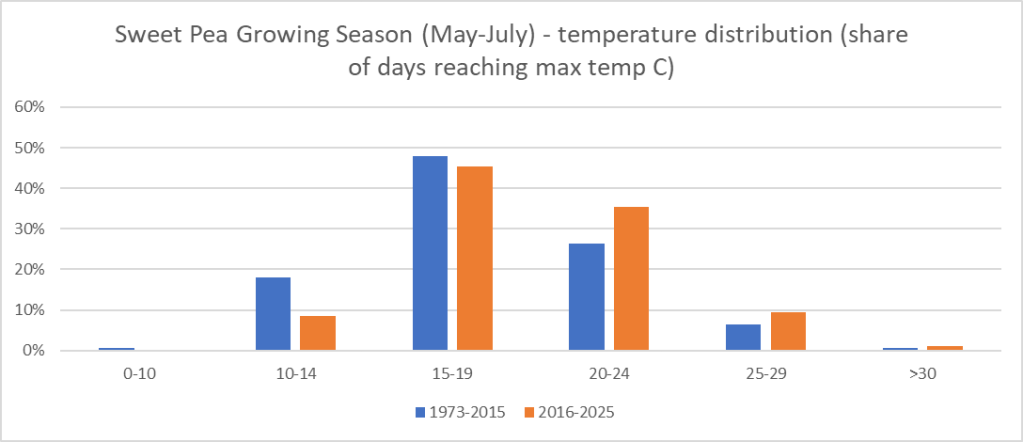
There are more hot days now than in earlier decades and fewer cooler days. The next chart shows the shift in the proportion of days reaching a max temperature falling in various ranges (The 42-year period 1973 to 2015 is shown in BLUE, and contrasts with the recent decade (2015-2025) shown in ORANGE).
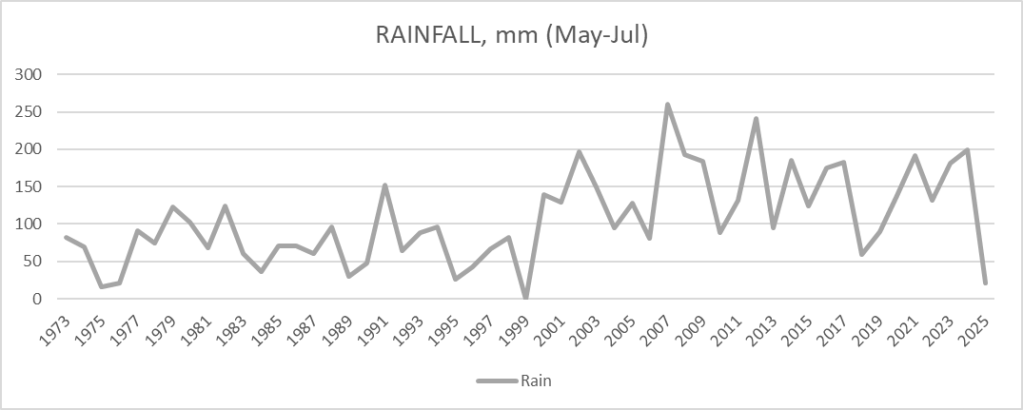
It has been very dry in 2025 (like 1999 and 1975/1976, which were also dry years). But the general trend is for wetter summers, but with more variation from year to year.
Short paper on modelling sweet pea growth is available on the separate drop down tab. This illustrates the effect of increased temperatures on sweet pea growing in the UK.
 Fairplace